
Reporting View
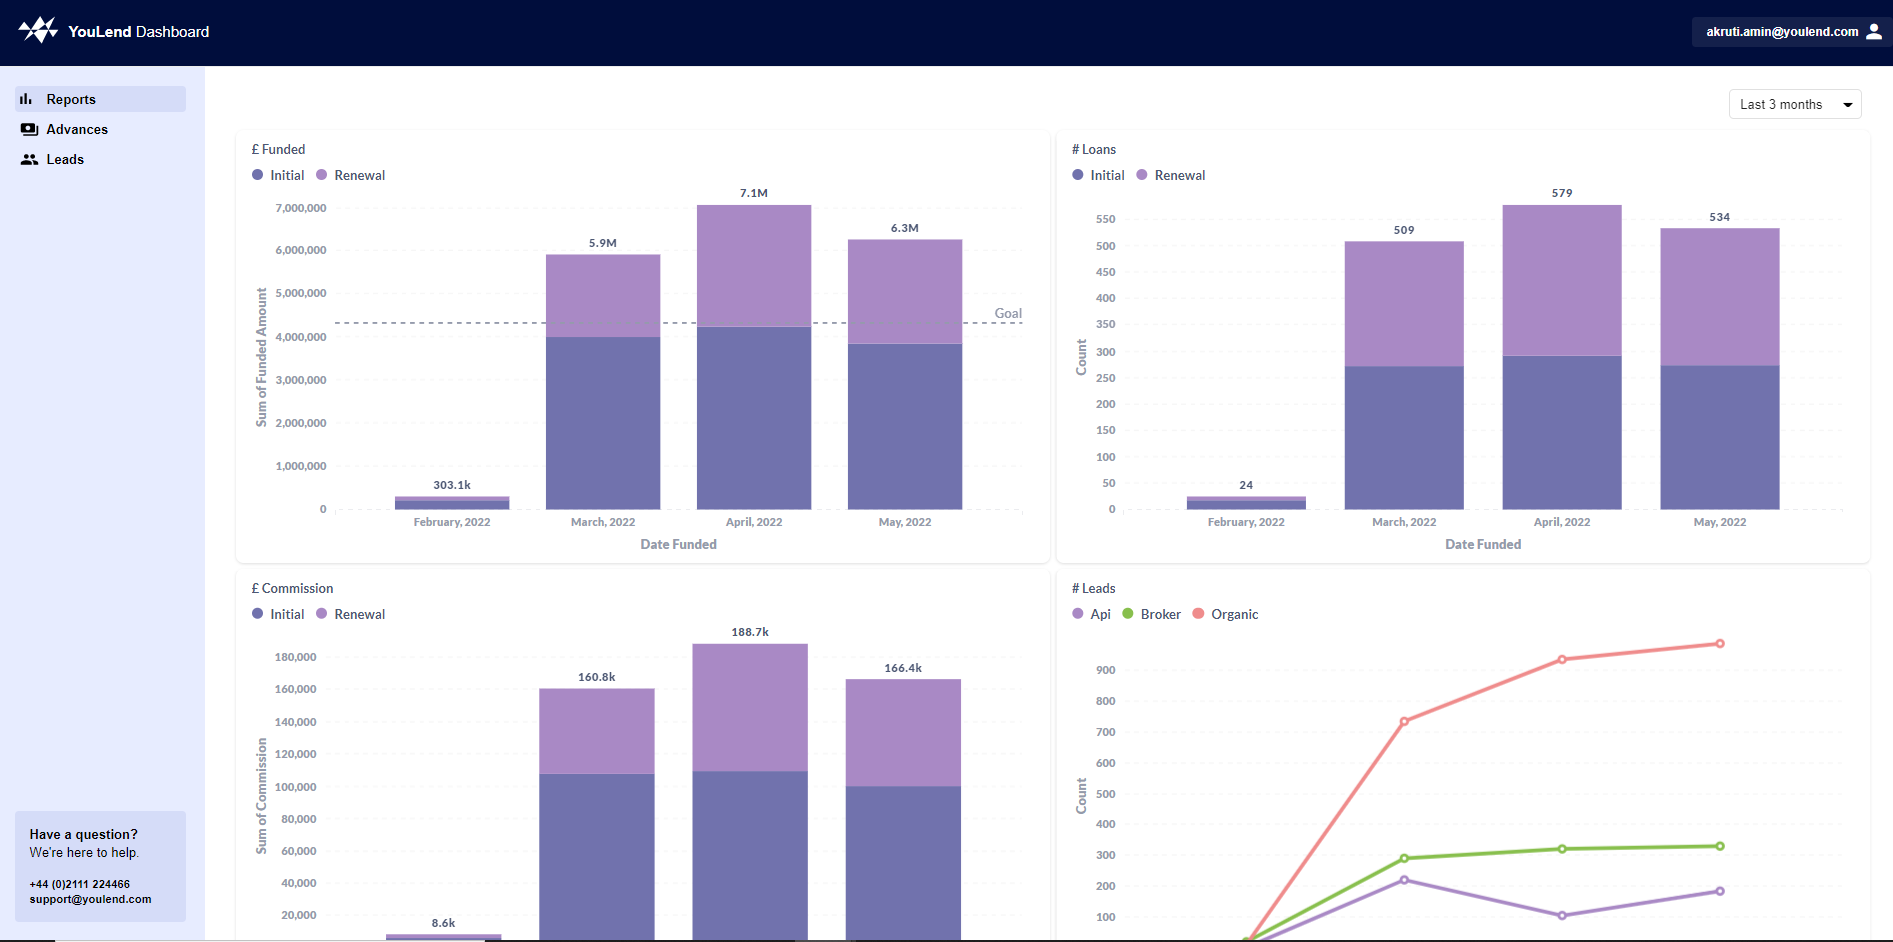
In the Reports tab, you can see graphs (with real-time data) visualising:
- £ Funded indicating sum funded by month, showing a split between initial applications and renewals
- Loans indicating count of loans by month, showing a split between initial applications and renewals
- £ Commission indicating sum of commission by month, showing a split between initial applications and renewals
- Leads indicating count of leads by month, showing a split between initial applications and renewals
Filtering data
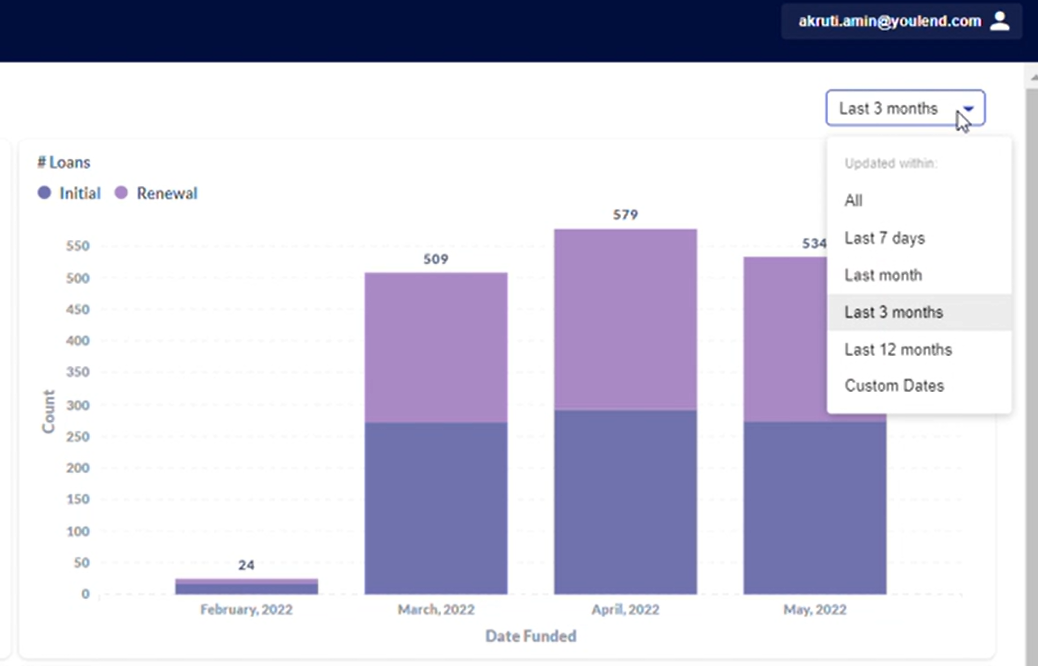
Upon opening the Reports tab, the last 3 months of data will be shown however you're able to change the date range for the graphs by using the filter located at the top right side of the page. The graph uses the Merchant 'Signup Date' when querying the date range date.
Exporting data
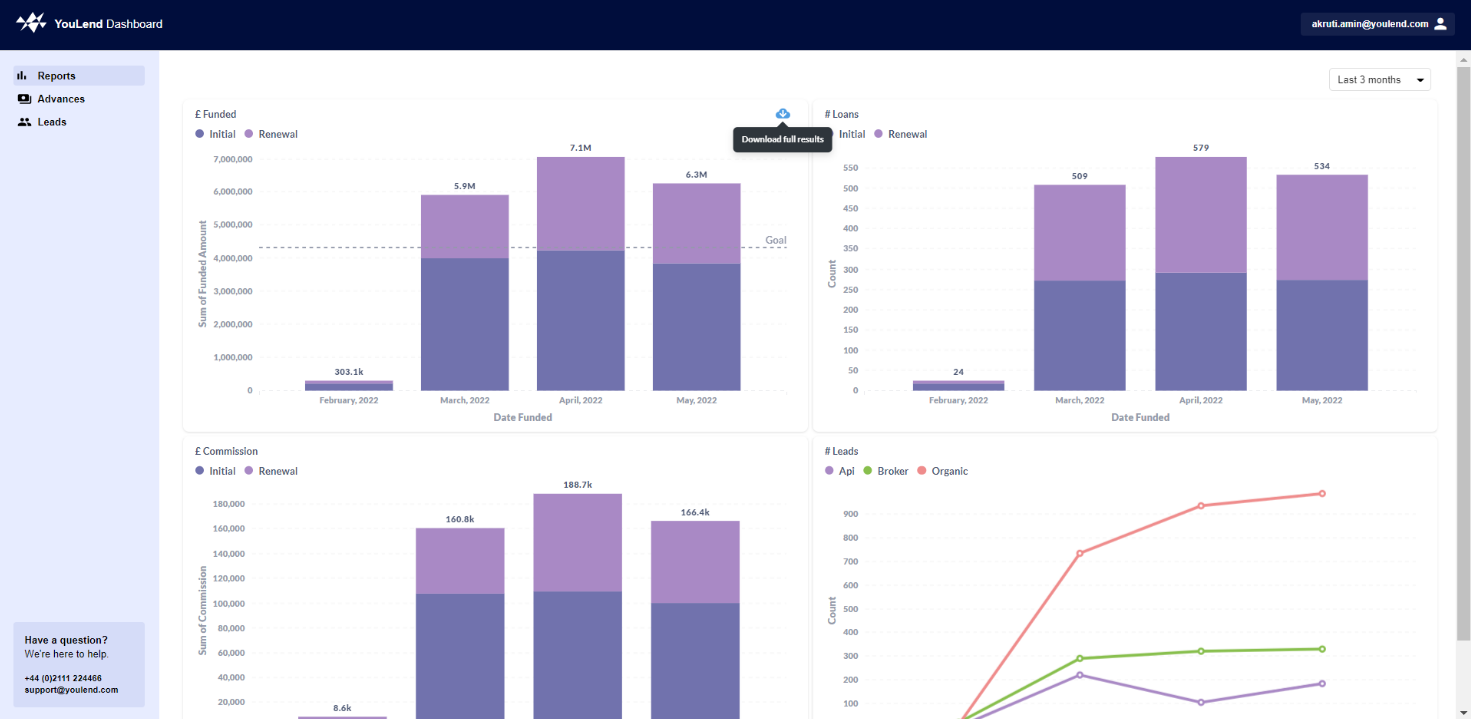
You can export the graph data using this cloud icon in the top right hand of each graph - please note that this will not export the underlying lead-level data.
Updated 3 months ago
Did this page help you?